


Commercial energy demand management systems
It’s time to make your energy work smarter - in seconds, not days
Our intuitive energy management solution enables you to securely manage, monitor and analyse your data, all in one place, helping you make informed decisions about energy usage and carbon reduction. Whether you’re working towards organisational decarbonisation targets or industry net-zero objectives, you can accurately track your progress and evidence your commitment. Wherever you are - on the road, on site or at home - energy management is at your fingertips.


EV Charging and Renewable Energy Installers
Using data surfaced by monitoring hardware and CT clamps, you’ll find a visual, real-time image of current energy levels and readings. These can also be viewed up to 12 months historically to understand patterns, such as higher demand across different seasons or in line with organisational operations.
![]()
Data analysis and strategy
Our intuitive platform allows you to analyse and determine patterns in the data, helping you to create a strategy or plan of action towards tackling energy inefficiencies. As well as your own solutions, we may also have some suggestions to help your energy work smarter, such as circuit-level monitoring and demand side management. For example, we can preset triggers to turn down equipment when kVa readings register as high, a quick win within your strategy.
![]()
Planned actions and support
It’s time to put your energy management plans into action. As you continue to monitor your energy in real-time, you will see where changes occur within your data. Through circuit-level monitoring, demand side management and other techniques, your data will reflect change. You can use this real-time data to evidence how your strategy is working to meet energy goals.
Energy management for electrical contractors
With a sophisticated energy management solution at your side, you can offer your clients real-time data, intuitive solutions and plans of action to meet organisational targets. Optimising electrical systems, reducing waste and lowering costs enables your client’s sites to thrive.
The Energy Analytics Platform enables you to securely manage and view the data you need across a range of sites and organisations. You can utilise the data supplied to provide solutions to your clients that help them futureproof their sites and optimise operations. Your clients could save money on their energy bills, all whilst demonstrating their commitment to decarbonising their organisation.


“Energy measurement is now the first and most important step of every client journey we embark on, and we now use Envisij on every project we work on.”
Jon Bumstead
Director, Neutral Home
.webp)
Cutting Energy Costs by up to 40%: How Envisij powers savings
See how Neutral Home halved HVAC energy costs, achieved a 35% ROI in 3 months, and used Envisij to deliver data-driven carbon savings. Read the Case Study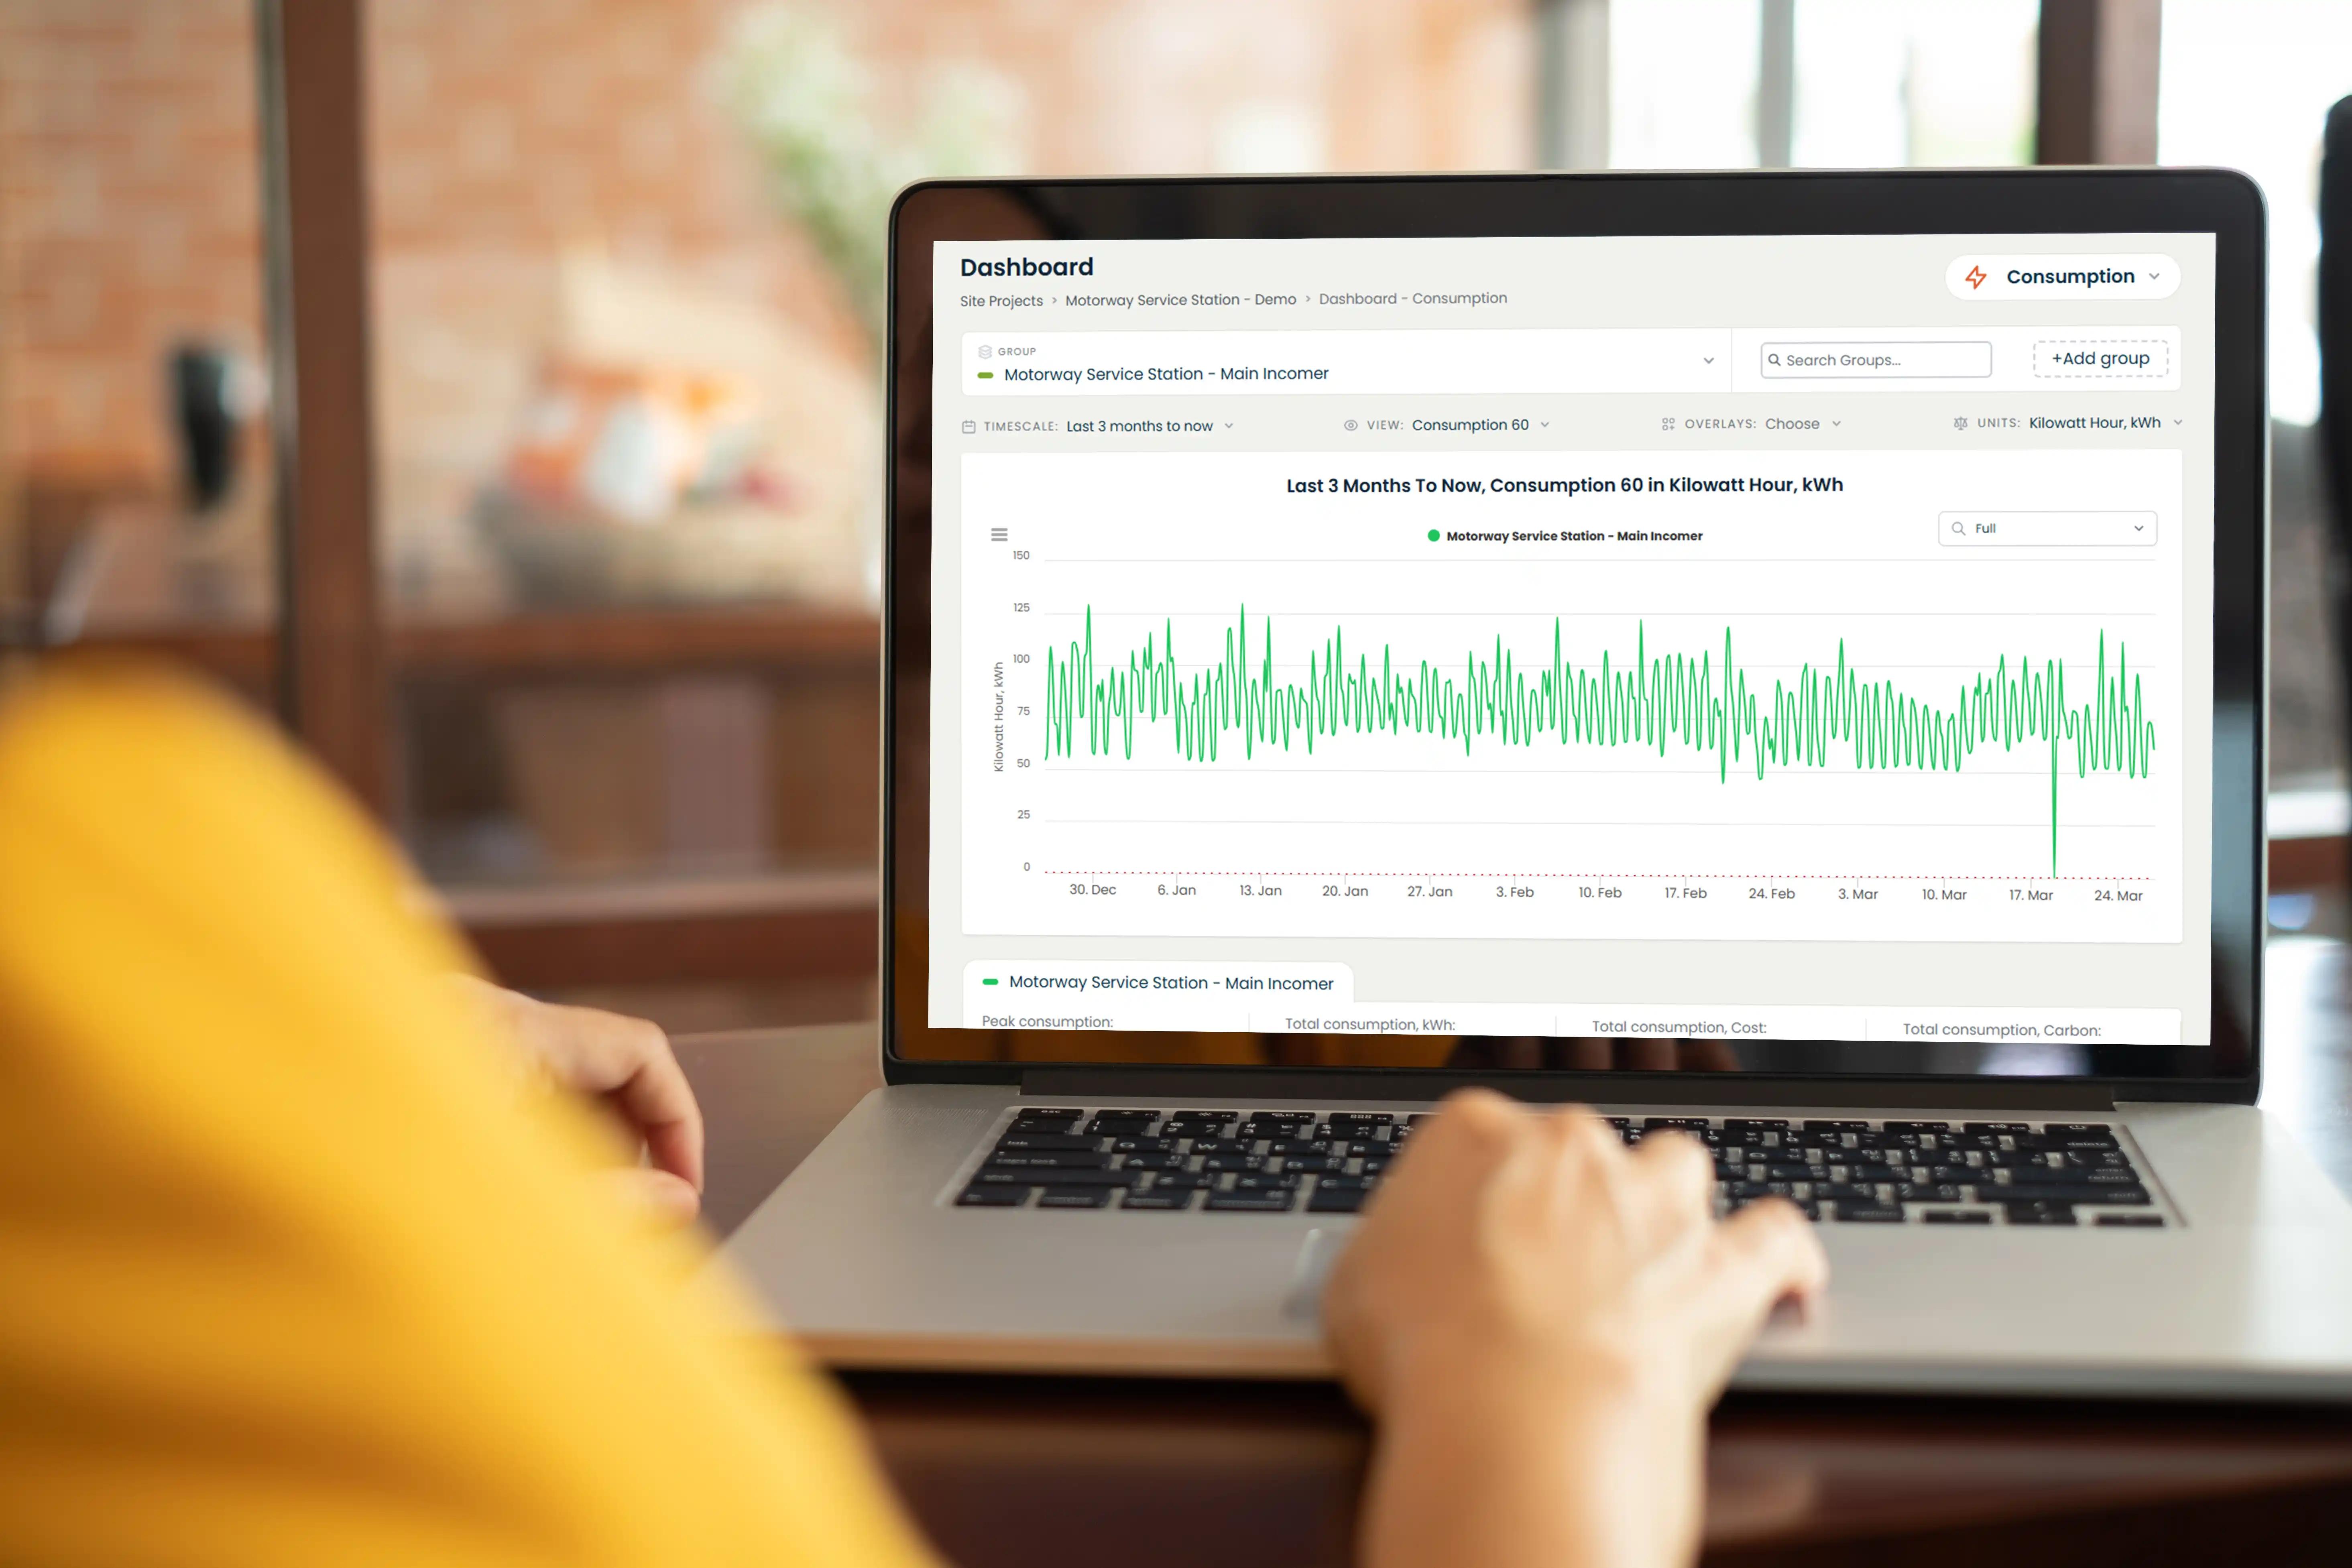
Envisij Enables PowaTrim to Cut Energy Costs and Reduce CO2 Emission
Discover how PowaTrim used Envisij’s real-time energy insights to prevent equipment failure, reduce energy use by 4%, and cut over 9 tonnes of CO₂. Read the Case Study-1.png)